Market Research
Sakshi
Oct 1, 2025
.avif)
Pricing a product or service can feel like walking a tightrope. Set the price too high and you risk scaring away customers; set it too low and people might assume your offering is low quality. If you’re a researcher, marketer, SaaS product manager, or small business owner, you’ve likely grappled with finding that “just right” price. This is where the Van Westendorp Price Sensitivity Meter comes in. In this deep dive, we’ll explore what the Van Westendorp method is, why and how it’s used, its impact on pricing decisions, and whether it’s still relevant in 2025. By the end, you’ll see why this half-century-old technique is still talked about – and how to use it like an expert in today’s market.
Developed by Dutch economist Peter van Westendorp in the 1970s, the Van Westendorp Price Sensitivity Meter (PSM) is a market research technique for gauging consumers’ price perceptions. In essence, it’s a survey-based method that helps identify a range of prices customers consider acceptable for a product or service. The approach has been widely adopted in the market research industry over the past few decades due to its simplicity and directness. At its core, the Van Westendorp method assumes that by directly asking customers about prices, you can uncover their internal thresholds – the points where a price becomes too expensive, too cheap, or just right.
In practice, the Van Westendorp PSM is implemented through a set of four specific survey questions. These questions prompt customers to consider price points that would make the product seem too cheap, a bargain, expensive (but still purchase-worthy), or too expensive . By collecting answers to these four questions from a sample of your target market, you get insight into consumers’ willingness to pay and their price sensitivity. The beauty of the method lies in its directness – rather than guessing or observing indirectly, you simply ask people about prices and listen to what they tell you .
Once you have the survey data, you analyze it by plotting the responses as cumulative distribution lines (one for each of the four questions). Where these lines intersect, you find critical pricing points that can guide your strategy. The Van Westendorp analysis typically yields an acceptable price range and indicates an optimal price point within that range . In the next sections, we’ll break down exactly how those questions are asked, what the resulting price points mean, and how to apply the findings to your business.
The Van Westendorp method revolves around four key questions posed to consumers about a product’s price. Each question probes a different perception of value and cost. Here are the classic Van Westendorp pricing questions you would ask in a survey :
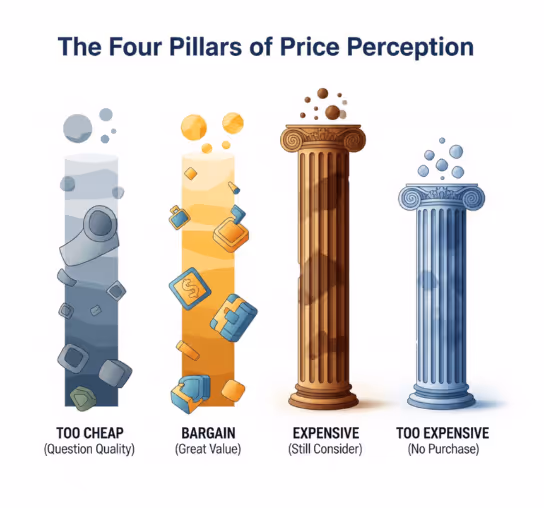
Respondents can answer these questions with specific price points (either open-ended or by choosing from a predefined list of prices). The idea is that each question taps into a different psychological threshold. For example, the “Too Cheap” question reveals the minimum price at which low price starts to undermine perceived quality , while the “Too Expensive” question reveals the maximum price at which the product loses almost all appeal . The “Bargain” and “Expensive-but-still-considerable” questions fill in the middle ground, indicating where customers see the price as favorable or beginning to strain their budget .
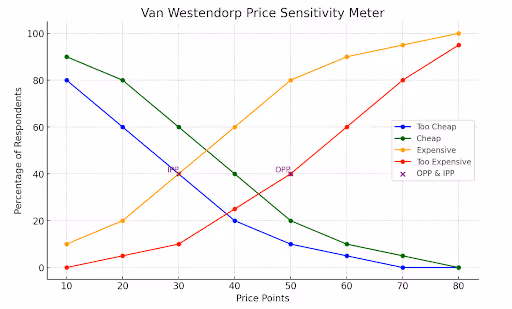
After collecting responses from a sufficient sample (often around 100–200 respondents or more for reliability), the next step is to plot the data. Typically, you plot the cumulative percentage of respondents for each of the four question categories across the range of prices mentioned. This yields four curves on a graph, representing the proportions of customers who feel the price is too low, a good value, expensive, or too high at each price point . By inverting the “cheap” responses (since fewer people will think a price is cheap as the price rises) and plotting alongside the “expensive” responses (more people find it expensive as price rises), you can visualize overlaps and crossing points . It might sound a bit abstract, but in the next section, we’ll look at what those intersection points actually signify in plain English.
Figure: Example of a Van Westendorp Price Sensitivity Meter plot. The four lines show the percentage of respondents who feel the price is “Too Cheap” (blue), “Cheap/Good Value” (green), “Expensive” (orange), or “Too Expensive” (red) at various price points. Key intersections are marked: the point where the “Expensive” and “Too Cheap” lines cross is the Indifference Price Point (IPP), and where the “Cheap” and “Too Expensive” lines cross is the Optimal Price Point (OPP). In this example, the OPP (around $40) is the price at which the highest percentage of customers find the price acceptable, while the IPP (around $30) is the point where sentiment shifts from cheap to expensive .
When you plot the Van Westendorp survey results, several critical price indicators emerge from the graph :
The range between the Point of Marginal Cheapness and the Point of Marginal Expensiveness is the acceptable price range for your product . Within this range, the IPP and OPP give you two key benchmarks: IPP (often a bit lower) indicates a price that customers find fair and unsurprising, whereas the OPP (often higher within the range) indicates a price that stretches customers to the limit of what still feels acceptable. Businesses often choose a price near or at the OPP if they’re aiming to maximize revenue without alienating customers, but they’ll keep the IPP and the overall range in mind to understand how much flexibility they have on either side.
It’s worth noting that these price points are guidelines, not hard rules. Van Westendorp analysis doesn’t automatically account for factors like your costs, target margins, or competitor pricing – so the “optimal” price here isn’t necessarily the profit-maximizing price (more on these limitations later). However, knowing the acceptable range and sweet spot is immensely helpful. It gives you an evidence-based starting point for pricing, rooted in customer perception. For example, if your Van Westendorp survey finds an OPP of $40 and an acceptable range of $30 to $50, you learn that pricing below $30 might undermine your product’s perceived quality, while pricing above $50 could severely limit your market. Anywhere in the $30–$50 band is fair game, and around $40 is the bull’s-eye based on customer sentiment.
Why would a business choose to use the Van Westendorp Price Sensitivity Meter? The short answer is: whenever you need direct insight into customers’ price expectations. Here are a few common scenarios where Van Westendorp shines:
Even outside of these specific scenarios, conducting a Van Westendorp analysis periodically can yield valuable strategic insights. It can uncover if there’s untapped willingness to pay more (meaning you’re potentially underpricing) or if competitive dynamics are pressuring customers to expect lower prices. In practice, many businesses use it as a starting point for pricing strategy: it’s quick, straightforward, and cost-effective, which means you can do it before resorting to more complex studies. As one source notes, even if you don’t have immediate plans to change your pricing, understanding where your product stands in terms of perceived value can help identify opportunities to increase sales or hit profit goals down the line .
The Van Westendorp pricing model wouldn’t be so enduring if it didn’t have some significant advantages. Here are a few reasons it’s remained a popular tool in the pricing toolkit:
Another benefit worth mentioning is that you can enrich Van Westendorp studies with extra questions to get even more value. Some researchers tack on follow-up questions like “How likely would you be to purchase at that price?” after each price-point question . This hybrid approach starts to blend Van Westendorp with a demand estimation exercise – it can help translate the price perceptions into an approximate demand curve or at least identify drop-off points more clearly. For instance, if you find the optimal price point via Van Westendorp, a follow-up question on purchase intent at that price can validate if people will actually buy or if they were just saying it was acceptable. By dividing the number of respondents who say they’d buy at a certain price by the total surveyed, you can estimate potential purchase rates . In short, while Van Westendorp is simple, it’s also quite adaptable and can be a springboard for deeper analysis.
No methodology is perfect. While the Van Westendorp Price Sensitivity Meter is valuable, it’s important to be aware of its limitations, especially in modern pricing scenarios. Here are some key caveats and drawbacks:
In summary, while the Van Westendorp Price Sensitivity Meter is a powerful starting point, it isn’t a one-stop solution. It gives a read on consumer price perceptions in a hypothetical sense. Smart practitioners use it in combination with other data – like cost analysis, competitive benchmarking, and experiments – to arrive at final pricing decisions. The good news is that knowing these limitations helps you mitigate them: for example, you might run separate surveys for different segments to handle the homogeneity issue, or incorporate a follow-up purchase intent question to add a demand aspect to the study. Next, we’ll briefly compare Van Westendorp to some other pricing research methods, which will further highlight where it excels and where it falls short.
When it comes to pricing research, Van Westendorp is just one tool in the toolbox. Two other common methods are often discussed alongside it: the Gabor-Granger technique and Conjoint Analysis (or other choice-based methods). Let’s see how Van Westendorp stacks up and in what situations you might prefer one over the others.
Van Westendorp vs. Gabor-Granger: Both of these are survey-based pricing models, but they approach the problem differently. Van Westendorp, as we’ve covered, asks open-ended questions where respondents supply price points that define their perceptions (cheap vs expensive). In contrast, Gabor-Granger presents respondents with specific prices and asks whether they would purchase at those given prices . For example, a Gabor-Granger survey might say: “Would you buy product X at $50? yes or no.” If yes, then ask at $60, if no, ask at $40, and so on – iterating to find the maximum price each respondent would pay. The question style is the biggest difference: Van Westendorp has people imagine their price thresholds, while Gabor-Granger has them react to concrete price options.
This difference leads to a few practical implications. Gabor-Granger produces data that’s often easier to analyze into a demand curve – since you get a yes/no (or likelihood to buy) at various price points, you can directly estimate what percentage of customers would buy at $40, $50, $60, etc. It’s more structured data, which can be simpler to interpret for pricing optimization (you might find, for instance, that demand drops off sharply beyond $55, which becomes an obvious pricing ceiling). Van Westendorp data, being open-ended, can be a bit messier and usually requires plotting and wrangling to interpret . Some respondents might give inconsistent answers (e.g. say $20 is too cheap and $25 is too expensive, implying an extremely narrow band), which you might need to clean or smooth out. In short, Gabor-Granger is more straightforward to evaluate since it’s basically a price vs purchase intent exercise, whereas Van Westendorp is more about mapping perceptions which then need interpretation.
So which one should you use? It often comes down to context and what you’re trying to learn . If you have no clue about pricing and need to establish a starting baseline, Gabor-Granger can be very helpful. It forces respondents to make a decision at specific prices, which can ground your strategy in something more concrete (it’s especially useful for new products where you want to gauge absolute willingness to pay in dollar terms). On the other hand, if you already have a price in market (or a good hypothesis) and you want to fine-tune or understand the perception around that price, Van Westendorp can provide richer insight into the range of acceptable prices and how customers mentally position your price. One 2025 review noted that for established businesses with some pricing experience, Van Westendorp is great for benchmarking and seeing if your price is on the mark, whereas Gabor-Granger suits businesses starting from scratch on pricing strategy .
Interestingly, these two methods can be complementary. The Van Westendorp gives you the psychological price boundaries and the “sweet spot” from a perception standpoint, and Gabor-Granger (or a direct purchase intent survey) can validate how those perceptions might translate into actual purchase rates . In fact, the survey by LimeSurvey suggests using Van Westendorp to get the broad range and then using Gabor-Granger to pinpoint more exact willingness-to-pay within that range . In summary, Van Westendorp focuses on acceptable price ranges and customer sentiment, while Gabor-Granger focuses on exact prices and purchase decisions; the choice depends on whether you need a broad strategic range or a precise demand curve.
Van Westendorp vs. Other Methods: Beyond Gabor-Granger, there are more advanced techniques like Conjoint Analysis (Choice-Based Conjoint) or Discrete Choice Experiments. Conjoint analysis presents customers with choices among products with various attributes (including price) to infer the value of each attribute and the trade-offs customers make. It’s powerful for understanding how price interacts with other features – something Van Westendorp doesn’t handle since it isolates price. Conjoint can simulate market scenarios and find the optimal price-feature combination, but it is considerably more complex, time-consuming, and expensive to run than a Van Westendorp survey. For many marketers and product managers, Van Westendorp is appealing because it’s quick and cheap and doesn’t require advanced analytical expertise, whereas conjoint analysis might require expert consultants or specialized software. The downside is that Van Westendorp ignores the feature trade-offs and competitive context that conjoint can capture .
Another approach increasingly used today is A/B testing and dynamic pricing – essentially, using real or simulated market experiments to find what prices yield the best results. For example, a SaaS company might experiment with different price points on small segments of their user base to observe actual conversion rates. While this is the most “real” data you can get, it’s not always feasible (it can be risky to show different prices to customers, and not every business has the volume or infrastructure for it). Van Westendorp, being a survey, is done before you go to market or as a market research exercise, so it doesn’t carry the same risks; it’s more of a hypothetical scenario. The trade-off here is between asking people what they would do versus watching what they actually do. Ideally, a savvy business uses the survey methods to narrow the field and then may test the waters with live experiments when possible.
In essence, Van Westendorp stands out for its simplicity and speed among pricing research methods. It’s not as granular or behavior-driven as some alternatives, but it gives a clear directional insight. Many professionals will use Van Westendorp as an initial filter or a sanity check, then possibly follow up with something like a Gabor-Granger analysis or a pilot pricing test to validate. Knowing about these other methods also underscores why Van Westendorp has its critics – some argue that in the era of big data and continuous experimentation, asking people about prices is old-fashioned. Let’s address that point directly: is Van Westendorp still relevant today, in 2025?
It’s a fair question – after all, the Van Westendorp Price Sensitivity Meter was conceived in the 1970s, and pricing science has evolved a lot since then. The answer from industry experts and our own experience is a qualified yes. The Van Westendorp method is still relevant in 2025, but with the understanding of its role and limits in a modern context.
On one hand, some pricing professionals argue that Van Westendorp is a bit dated. They point out, as we have, that it ignores many factors and can lead to simplistic or even misleading results if taken at face value. One pricing technology firm flatly stated that “the Van Westendorp pricing model is a thing of the past,” mainly because today’s pricing decisions benefit from far more data and dynamic analysis than a single survey can provide. Modern pricing strategy often involves real-time market data, dynamic pricing algorithms, competitor price monitoring, and AI-driven adjustments that continuously optimize prices based on demand and supply factors . In such a world, a static survey of what people say they’d pay might seem less critical. Companies at the forefront are indeed using sophisticated tools – considering everything from seasonality to inventory levels to personalized customer behavior – to set and tweak prices on the fly. The Van Westendorp model doesn’t incorporate any of that, so by itself it might produce recommendations that a purely data-driven pricing AI would override.
However, it’s important to realize that not every business has the ability to do dynamic or experimental pricing easily, and even those that do, still need a starting point and a strategic framework. Van Westendorp remains highly relevant for early-stage pricing research and for situations where you need a quick pulse from the market. In fact, even cutting-edge tech companies have found value in this method. A notable example: OpenAI reportedly used a Van Westendorp-style survey to help determine the price of ChatGPT Pro. When they were deciding on the $20/month subscription fee for the service, they “didn’t guess” – they asked users four pricing questions and identified a price range that felt reasonable, thereby avoiding overpricing or underpricing the product . The result was a price point that users accepted and that made business sense, achieved using a 50-year-old research technique. This story highlights that, in 2025, the method can still deliver smart insights even for a company on the AI frontier.
The continued use of Van Westendorp comes down to practicality and insight. It’s an accessible way to bring the voice of the customer into pricing decisions. When used with open eyes (i.e., knowing its biases and combining it with other information), it can prevent big pricing mistakes. For example, a startup with a new gadget might internally feel it could charge $100, but a quick Van Westendorp study might reveal that customers see $70 as the upper acceptable limit – saving the company from a potentially disastrous overpricing error. Conversely, a small business might learn that customers would still find their service a bargain at a higher price than they currently charge, suggesting an opportunity to increase prices and improve margins. These kinds of insights are timeless in value.
Moreover, training and professional circles in market research continue to teach and use Van Westendorp as a standard approach . It’s not as flashy as big-data pricing optimization, but it provides a structured way to talk about pricing with stakeholders. In many cases, decision-makers find comfort in seeing those clear “too cheap to too expensive” charts – it gives a narrative to customer sentiment that can complement hard sales data.
The bottom line: In 2025, Van Westendorp’s Price Sensitivity Meter should be viewed as one input among many in pricing strategy. It’s still relevant for what it does best: quickly capturing customer price perceptions. If you use it, do so as part of a broader pricing process. For instance, you might start with Van Westendorp to identify a ballpark range and an optimal price candidate, then validate that candidate with a small-scale market test or by checking it against your cost/profit calculations and competitor prices. Many companies indeed are blending approaches – using survey-based insights upfront and then relying on live data and AI tools to refine and adjust pricing continuously.
In conclusion, the Van Westendorp PSM remains a valuable tool in 2025 for researchers, marketers, product managers, and business owners. Its longevity is owed to its simplicity and the clear window it provides into the customer’s mind. When wielded by experts (that’s you, now!) who understand both its power and pitfalls, it can guide pricing decisions in a way that feels both customer-informed and strategically sound. The market may change, technology may advance, but understanding what your customers perceive as “too expensive” or “good value” will always be a cornerstone of smart pricing. The Van Westendorp method, used wisely, ensures you’re not flying blind when you set that all-important number on the price tag.
%20(6).avif)
Market Research
Sakshi
Oct 22, 2025
Read full blog
.png)
Discover what’s possible with intuitive tools for surveys, communities, and reporting built for real research.
Built for research by research professionals.
Providing solutions to research agencies, marketing agencies, internal research teams, government, educational institutions, solo researchers and everyone in between.
Copyright ©2025 | Q-Fi Solutions Inc.


%20(8).avif)
.png)